Software-Only Trace

Get Insights of your System with Software-Only Trace Solutions

To gain deep insights into your embedded system, hardware-based off-chip trace is generally the preferred way to obtain real-time, non-intrusive information about program flow and data operations. Even if off-chip trace is not available, for example due to processor or board limitations, TRACE32® still provides powerful trace capabilities through two purely software-based methods: LOGGER and FDX (Fast Data eXchange) trace, complemented by TRACE32® SNOOPer for analysing run-Time-behaviour without instrumentation. Both enable you to perform use cases like function and task run-time analysis. To utilize TRACE32® software trace, no extra TRACE32® trace module or TRACE32® trace license is required.

Analyze Chips without
Trace IP

Enables AUTOSAR ARTI Profiling

Three Options for Optimized Use with All Chips

Utilize Software Trace according to your needs

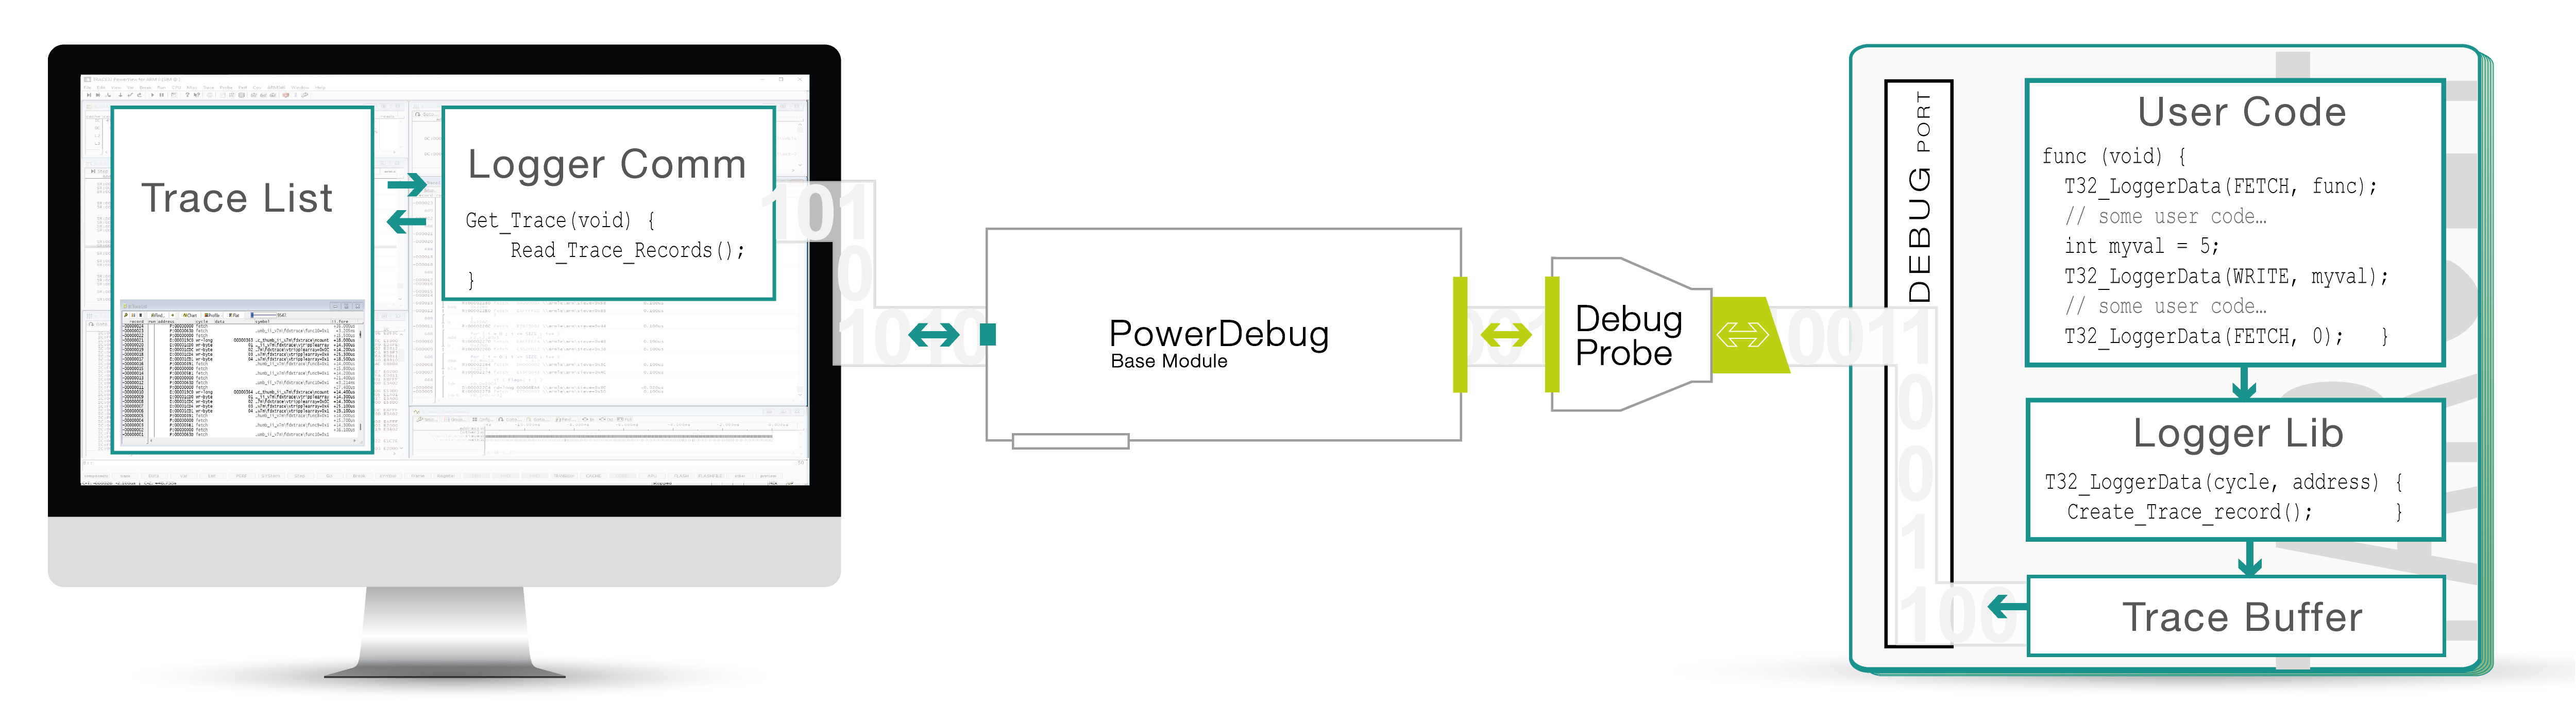
Both LOGGER and FDX are software-based trace methods that require modifications to the target application, which is instrumented to write trace information into reserved memory. We provide dedicated source file sets for LOGGER and FDX trace, which are integrated into the target application.

Software-Only Trace with LOGGER

LOGGER is a software trace method which requires a modification of the target application in order to write specific trace information to a reserved buffer on the target memory using a trace format provided by Lauterbach. Once recording stops, TRACE32 retrieves the data from target memory for display and analysis. If the buffer becomes full, the application can either overwrite older entries (FIFO mode) or stop writing new data (Stack mode). The trace method LOGGER is mainly used when no hardware based trace is available.

LOGGER Support for AUTOSAR ARTI

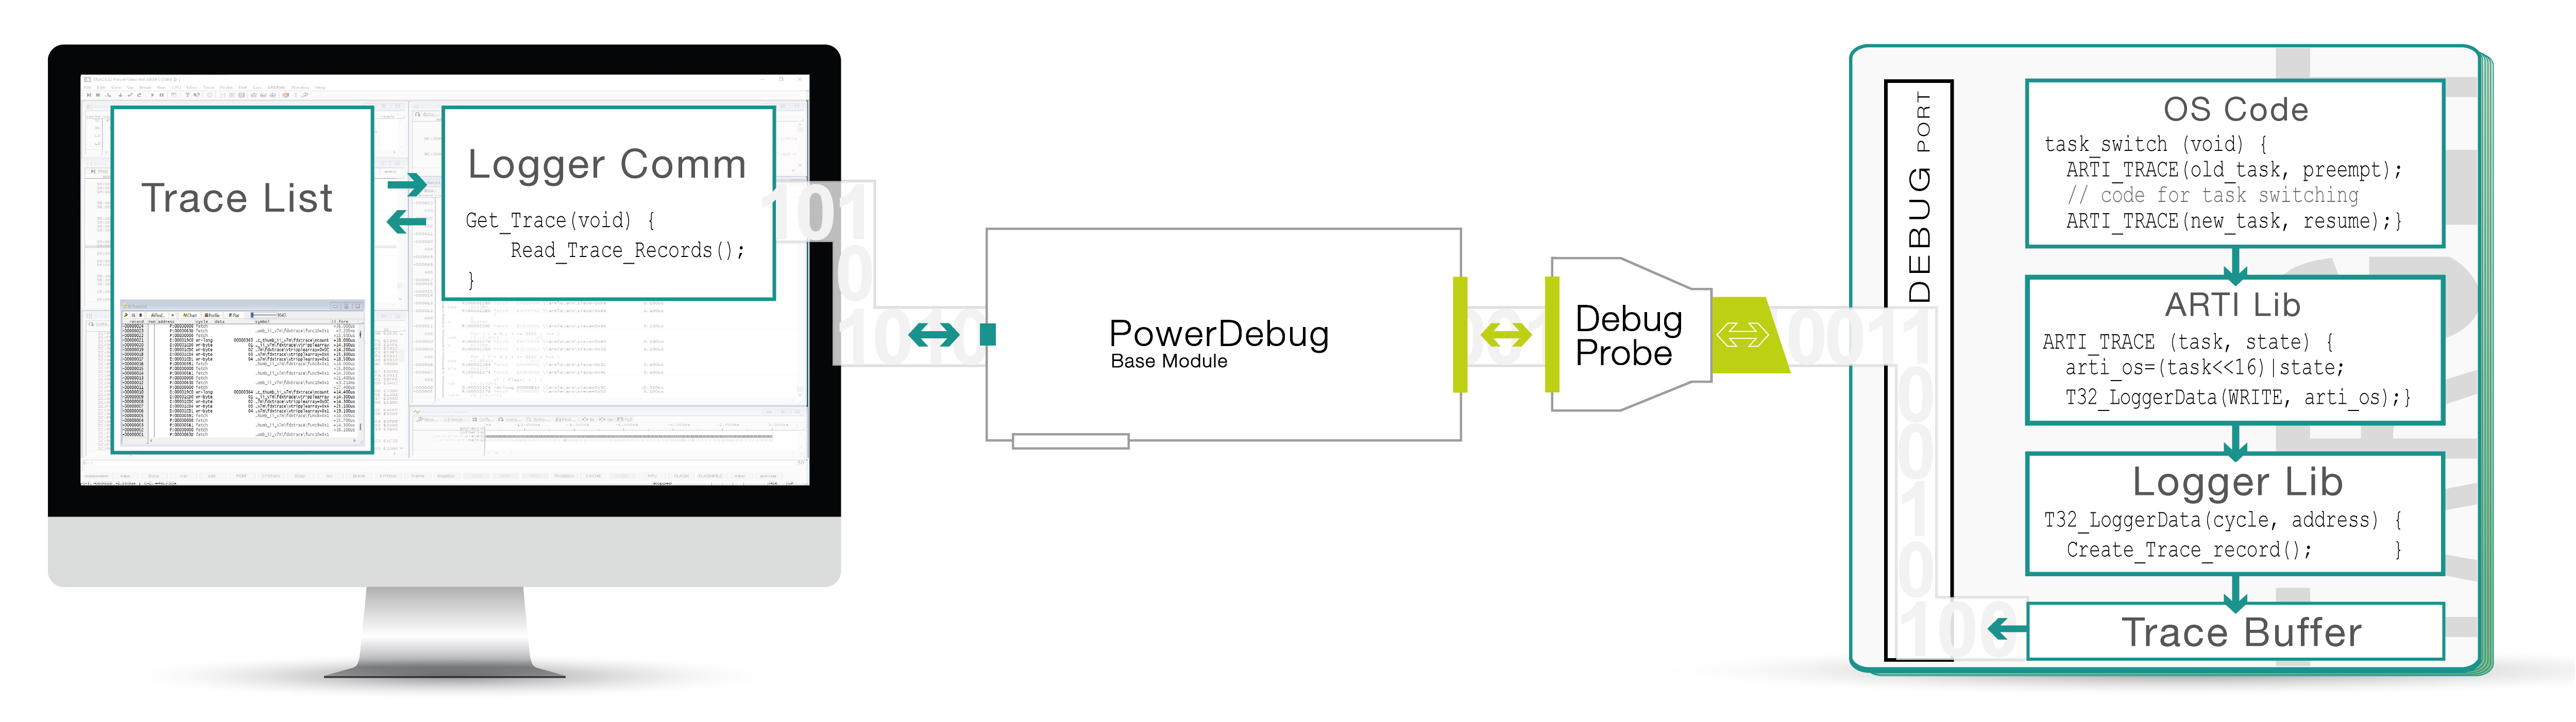
We provide dedicated support for tracing AUTOSAR Classic Platform systems (CP) through instrumentation trace based on the AUTOSAR Run‑Time Interface (ARTI) trace hooks. The trace message for the event-of-interest is generated by the LOGGER trace instrumentation in the target application when a write access to the ARTI trace variables occur. There are two implementations available: one for SMP and one for single-core. The SMP variant is free of spinlocks, but uses a inter-core buffer management that adds small overhead compared to the single-core variant.

Learn more about TRACE32 AUTOSAR Support

Software-Only Trace with FDX

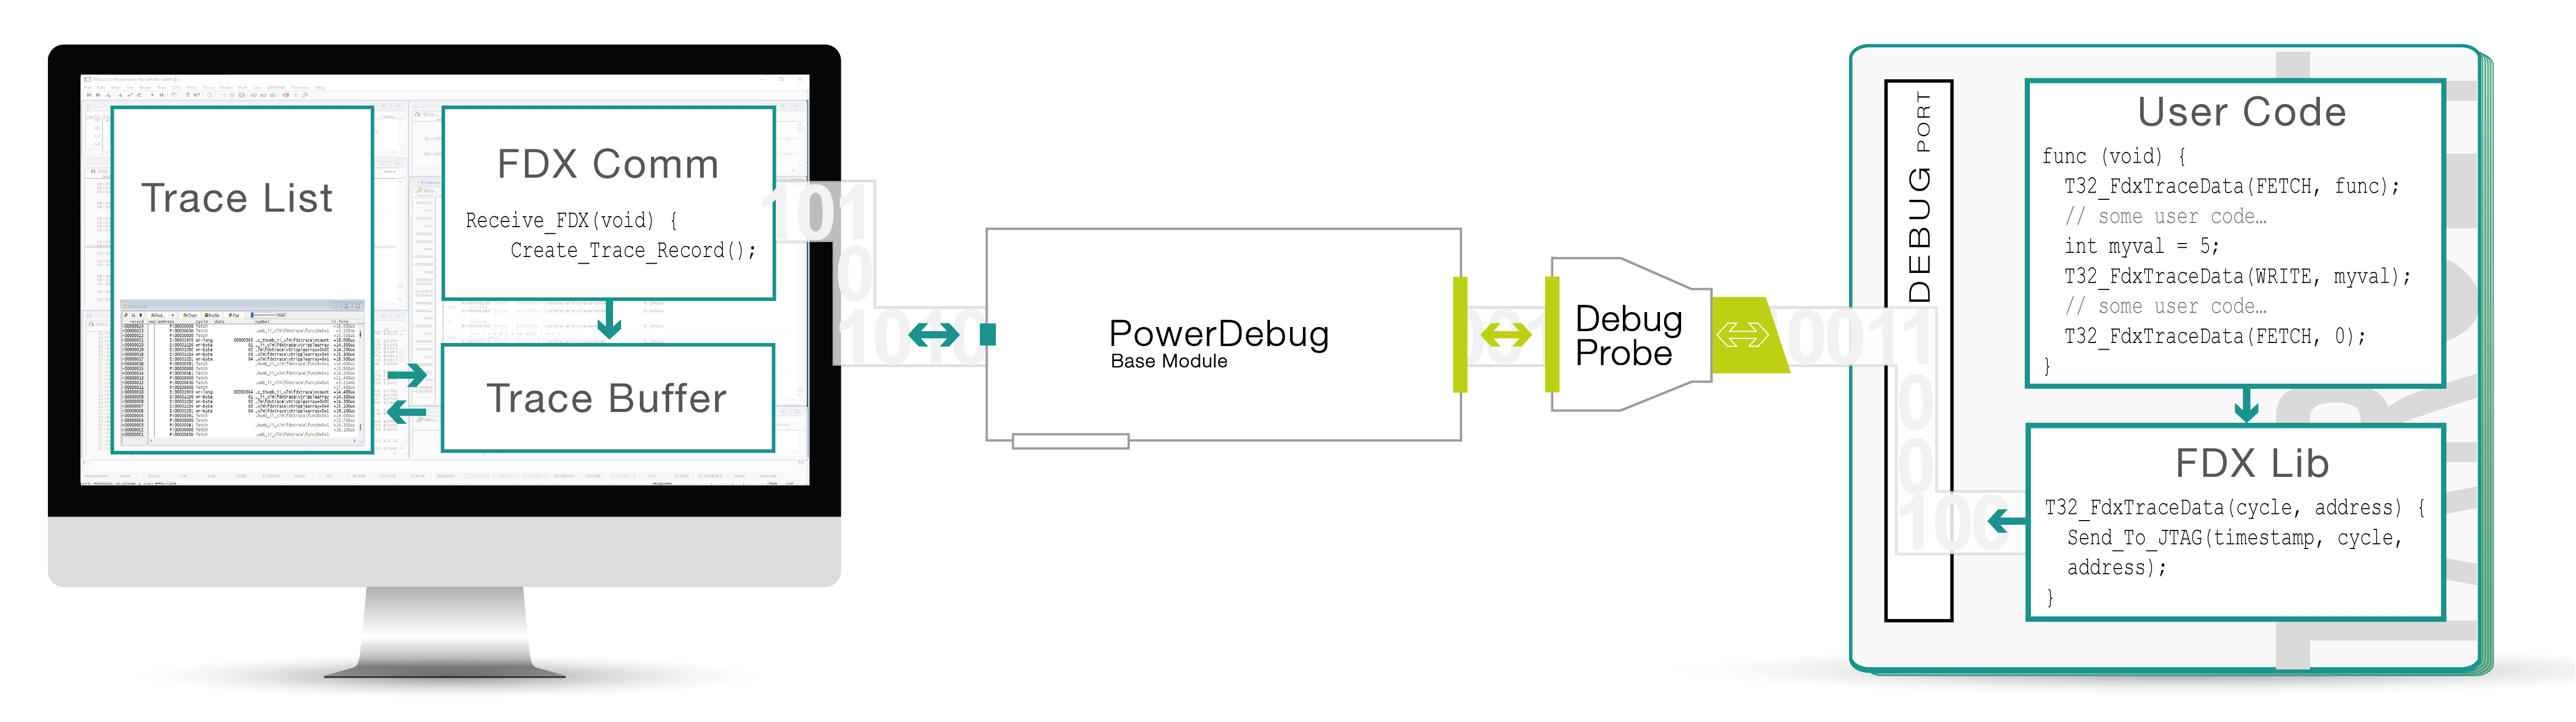
FDX (Fast Data eXchange) software trace streams trace information to the TRACE32® PowerView software on the host, typically via memory access during execution. TRACE32® is capable to interpret the FDX data stream and handle it as ordinary trace information device. The target application writes the required trace information to a small ring buffer (min. size 2 trace records). The buffer acts as a temporary FIFO, enabling longer recording sessions. If the communication channel cannot transfer data quickly enough, the FDX target code stalls execution to prevent data loss. The FDX host application ensures that the data is transferred from the target trace buffer to a large trace buffer on host computer while the program execution is running. If the chip implements an on-chip debug unit with Debug Communications Channel (DCC), the required trace information can be transferred directly to the TRACE32® PowerView software.

FDX Support for AUTOSAR ARTI

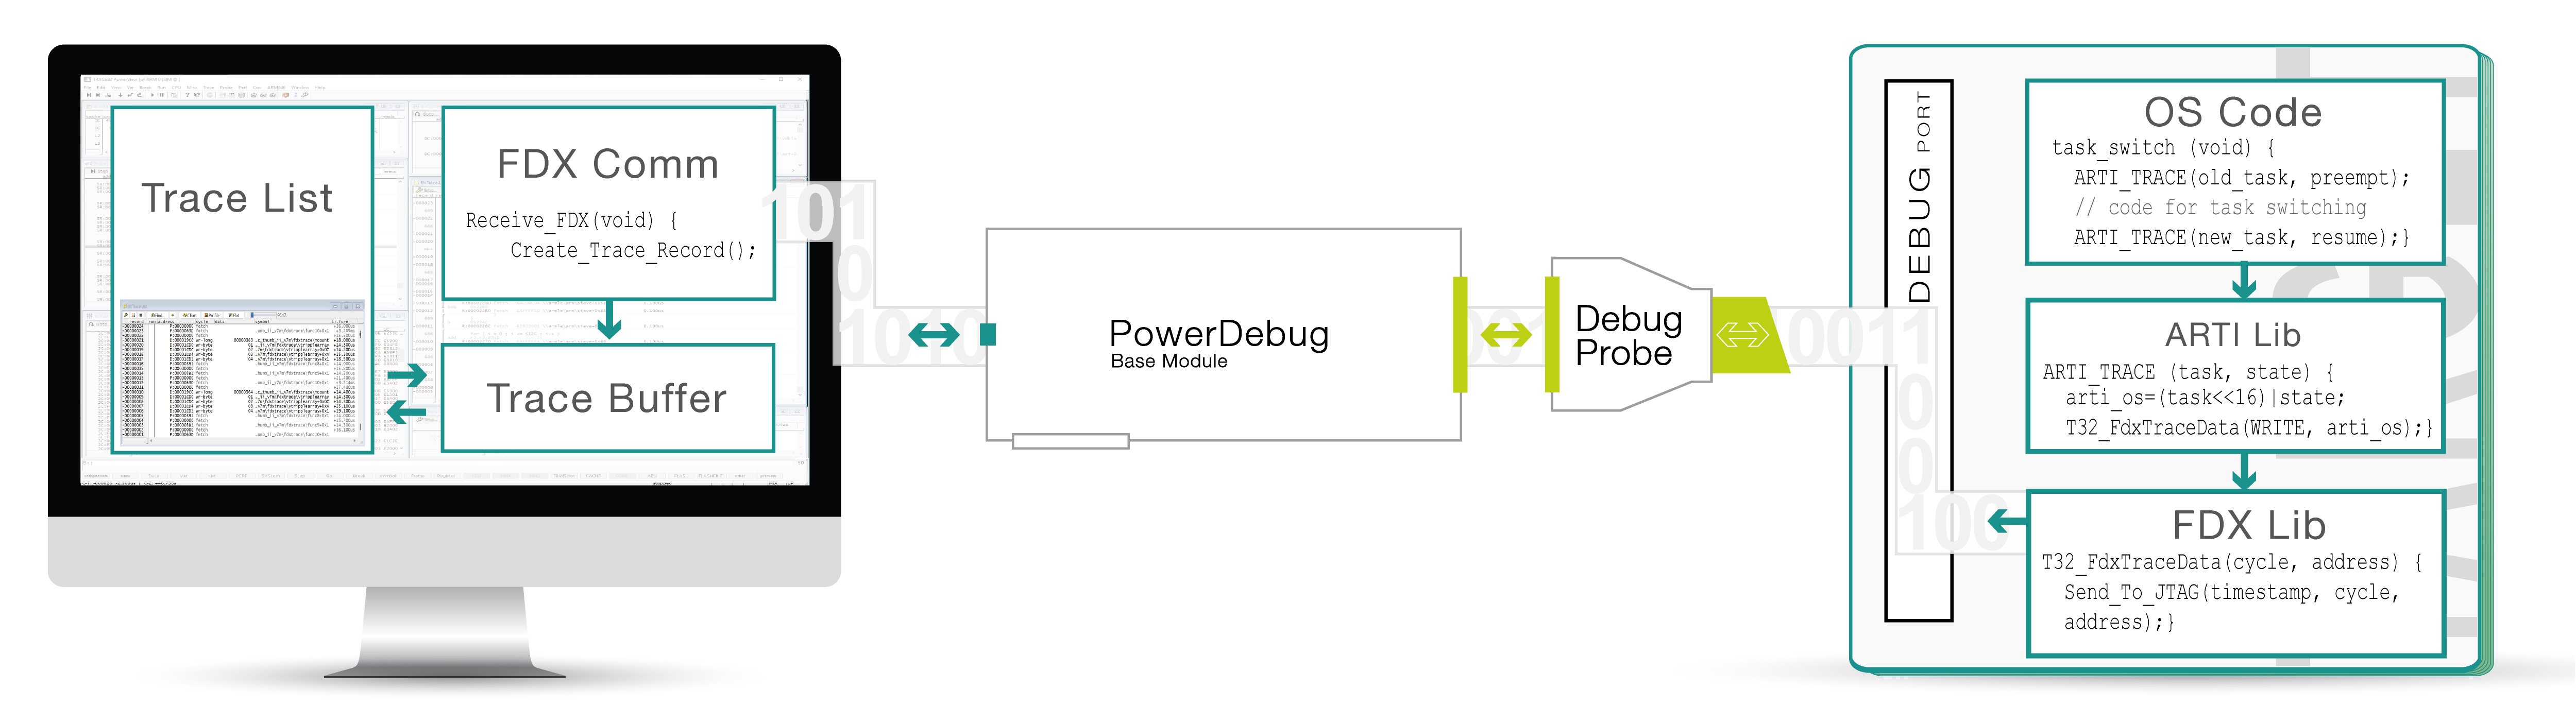
We provide dedicated support for tracing AUTOSAR Classic Platform systems (CP) through instrumentation trace based on the AUTOSAR Run‑Time Interface (ARTI) trace hooks. The trace message for the event-of-interest is generated by the FDX trace instrumentation in the target application when a write access to the ARTI trace variables occurs. There are two implementations available: one for SMP and one for single-core. The SMP variant uses spinlocks, thus adding small time overhead compared to the single-core variant.

Learn more about TRACE32 AUTOSAR Support

TRACE32® SNOOPer: Analyse Run-Time-Behaviour without Instrumentation

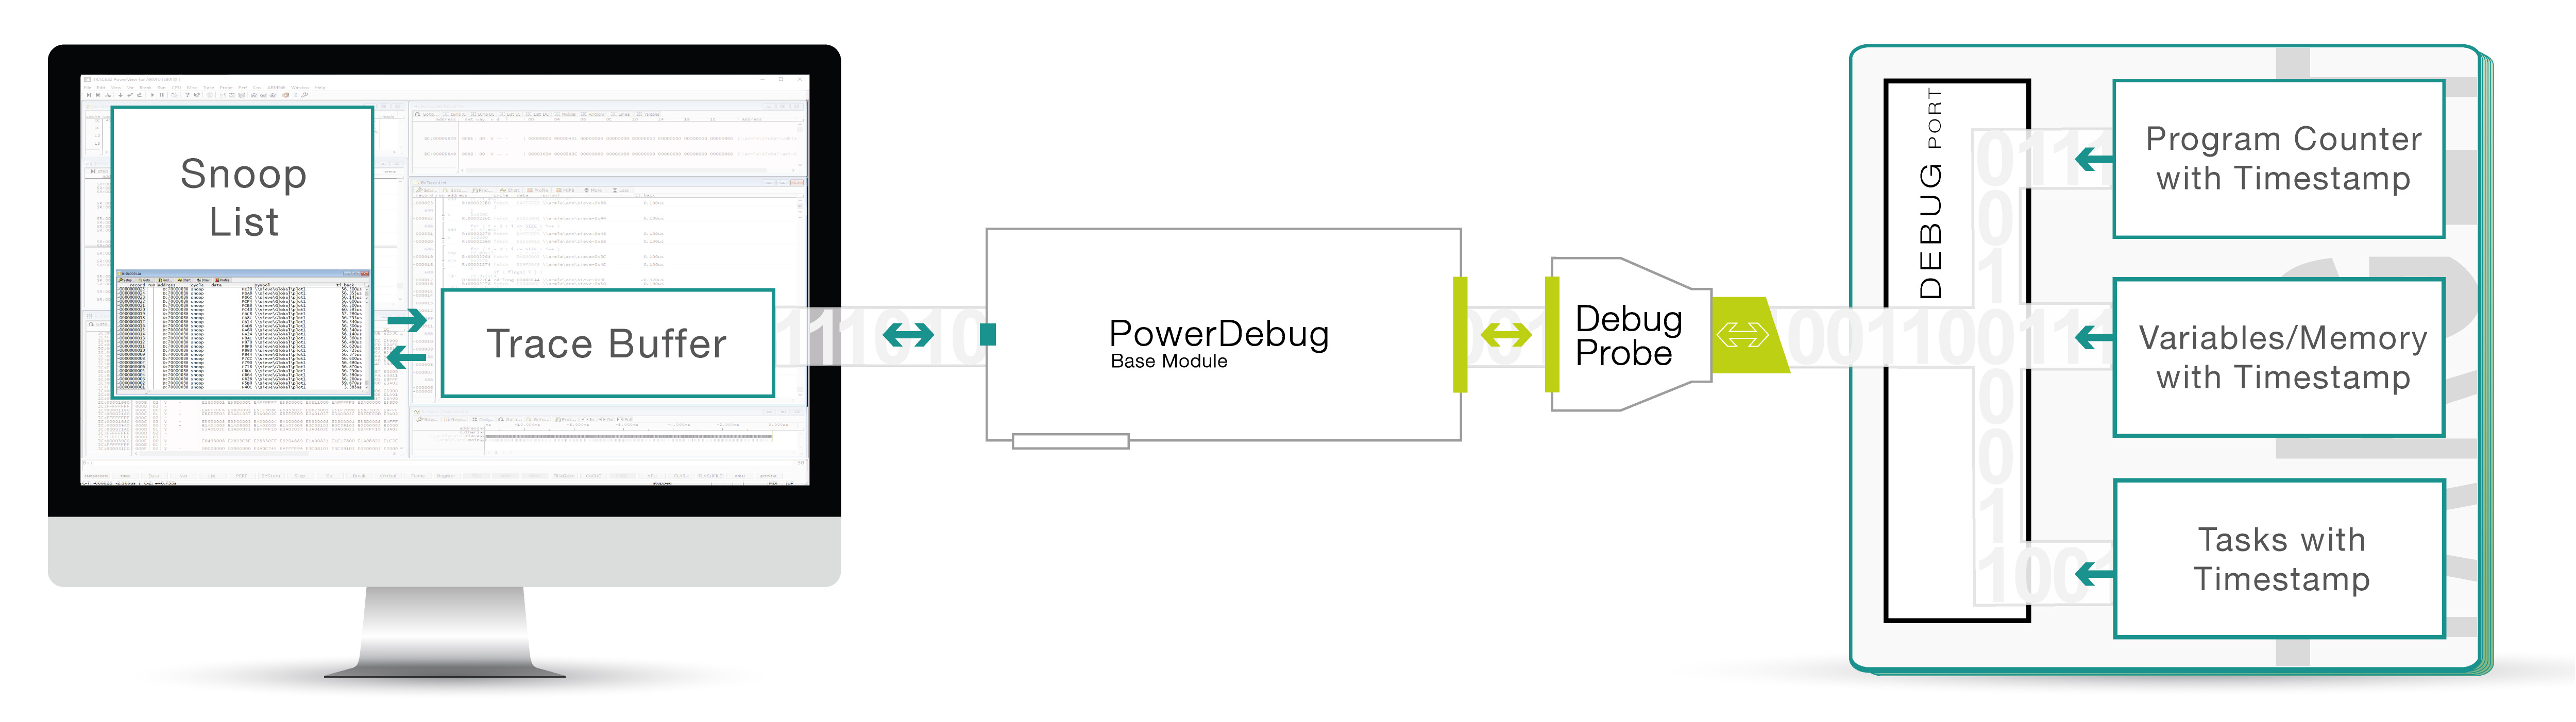
In some cases, instrumentation-based LOGGER and FDX software trace is not feasible, for example, when the target code cannot be modified. In such situations, the only available option to gain an overview of run-time behavior is sample-based profiling. TRACE32® supports this approach through its SNOOPer feature (Sample-based profiling). Sample-based profiling works by periodically collecting snapshots of the program counter and/or data values. For task tracing, this can be achieved by sampling the variable that stores the current task identifier. Because the trace relies on periodic sampling rather than continuous recording, the results are approximate and inherently include a statistical margin of error. Sample-based profiling is therefore useful for obtaining a broad overview of run times, but it is not suitable in scenarios where precise accuracy is required, such as verifying function or task run-time constraints. In conclusion, TRACE32® Sample-based profiling (SNOOPer) offers a lightweight alternative when instrumentation is not feasible, delivering a broad overview of runtimes but with reduced accuracy, especially for peak values.

TRACE32® SNOOPer: Analyse Run-Time-Behaviour without Instrumentation

In some cases, instrumentation-based LOGGER and FDX software trace is not feasible, for example, when the target code cannot be modified. In such situations, the only available option to gain an overview of run-time behavior is sample-based profiling. TRACE32® supports this approach through its SNOOPer feature (Sample-based profiling). Sample-based profiling works by periodically collecting snapshots of the program counter and/or data values. For task tracing, this can be achieved by sampling the variable that stores the current task identifier. Because the trace relies on periodic sampling rather than continuous recording, the results are approximate and inherently include a statistical margin of error. Sample-based profiling is therefore useful for obtaining a broad overview of run times, but it is not suitable in scenarios where precise accuracy is required, such as verifying function or task run-time constraints. In conclusion, TRACE32® Sample-based profiling (SNOOPer) offers a lightweight alternative when instrumentation is not feasible, delivering a broad overview of runtimes but with reduced accuracy, especially for peak values.

ご質問は?

40年以上にわたって業界をリードしてきた当社の専門エンジニアが、お客様をサポートいたします。製品に関するアドバイスや、どの構成が最適かをお知りになりたい場合は、セールスエンジニアにお問い合わせください。 ローターバッハ システムに関するサポートが必要な場合は、当社のエンジニアリング・サポート・チームにご連絡ください。