x86 Debugger & Trace

概要

Debug and Trace any Core in x86 SoCs

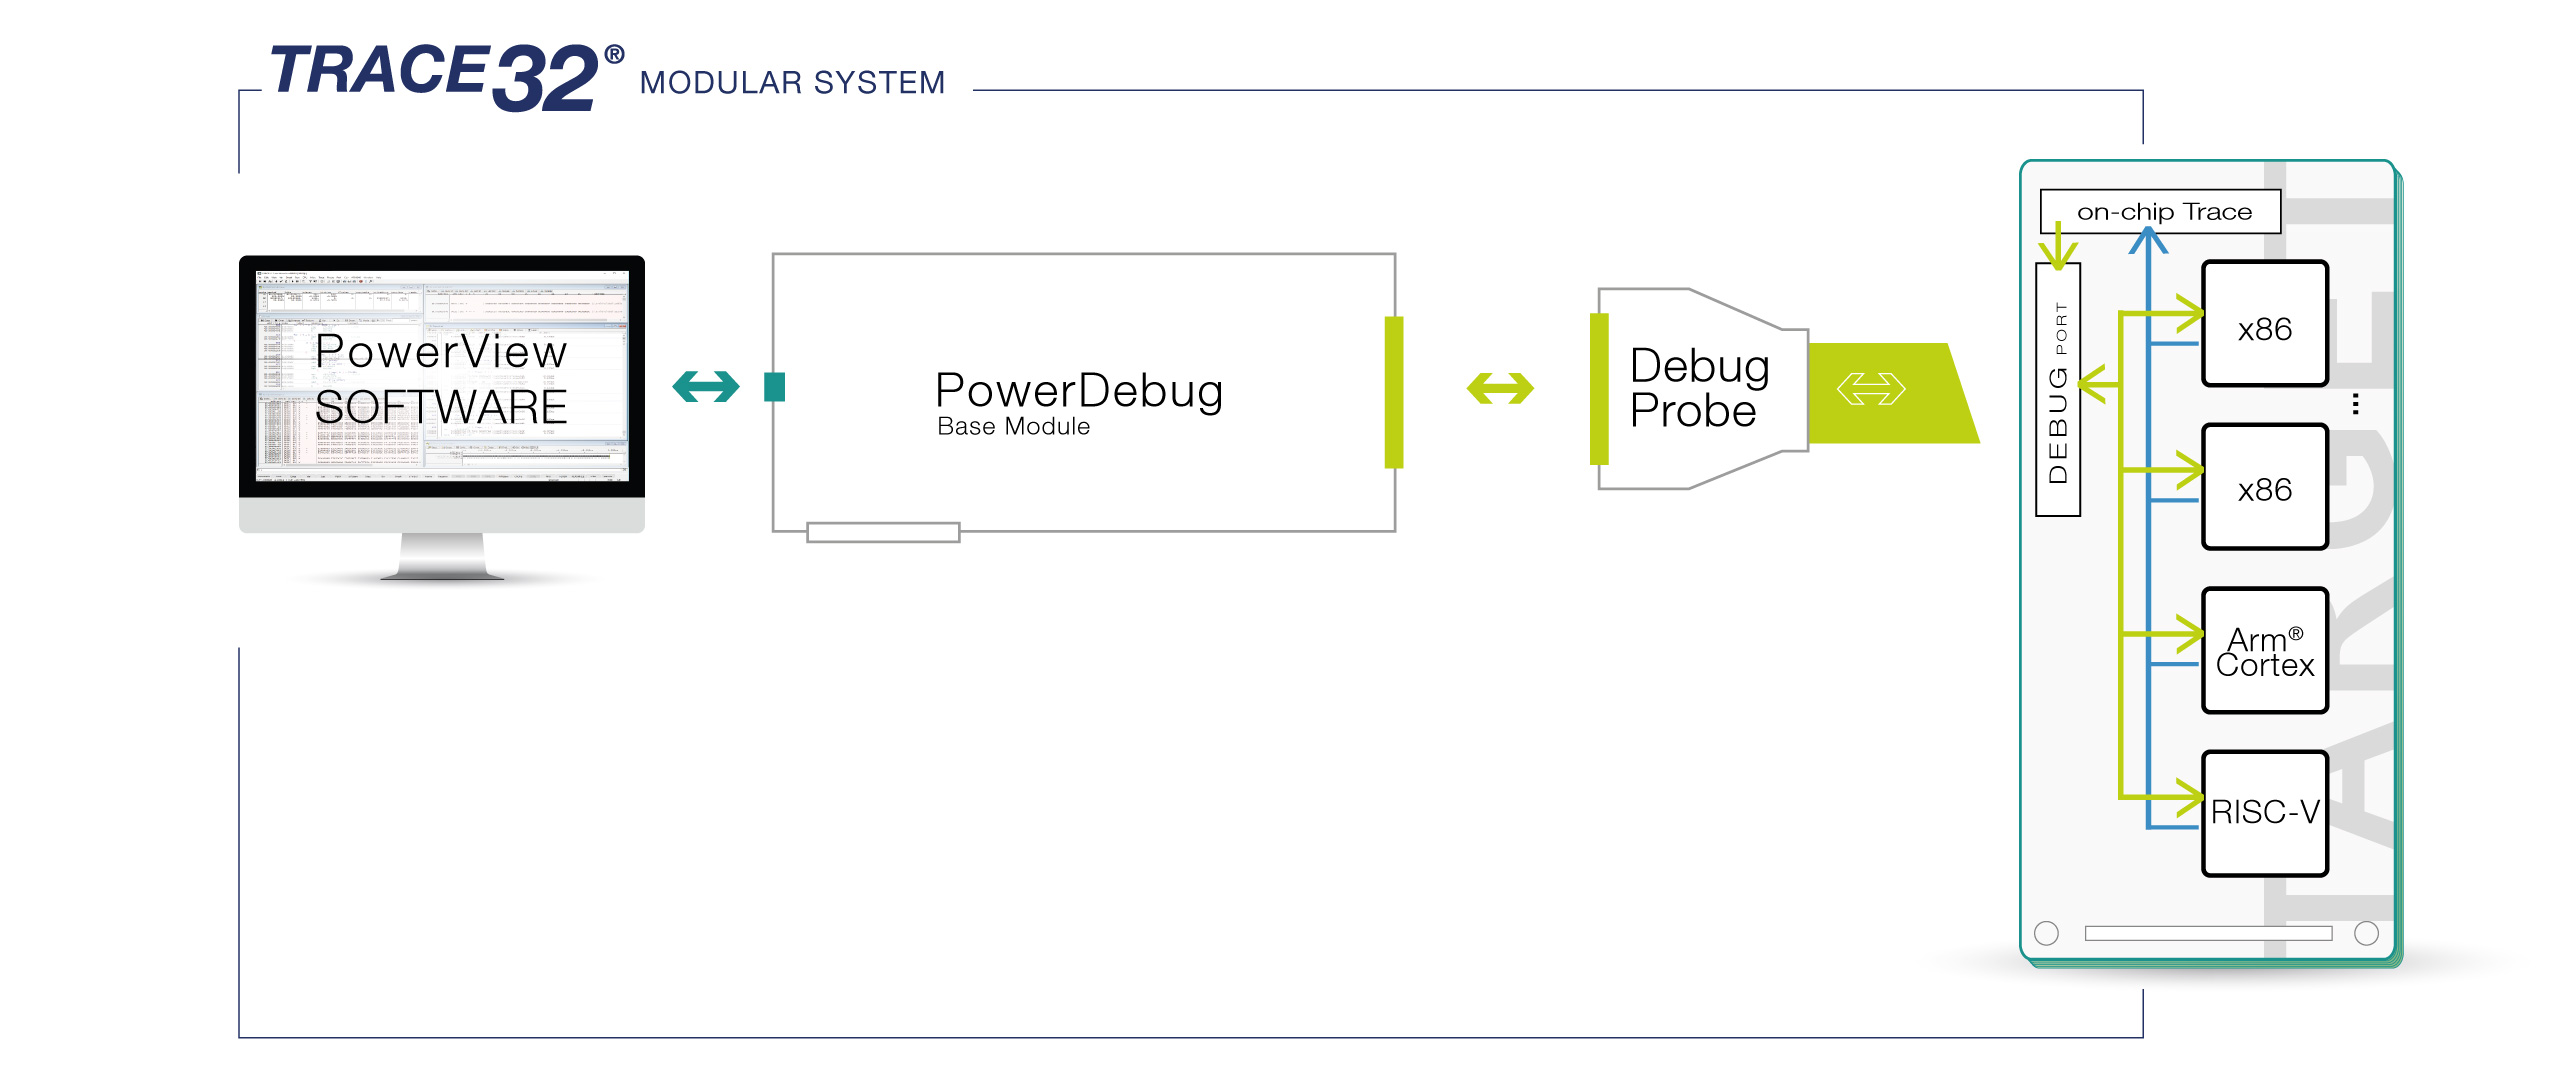
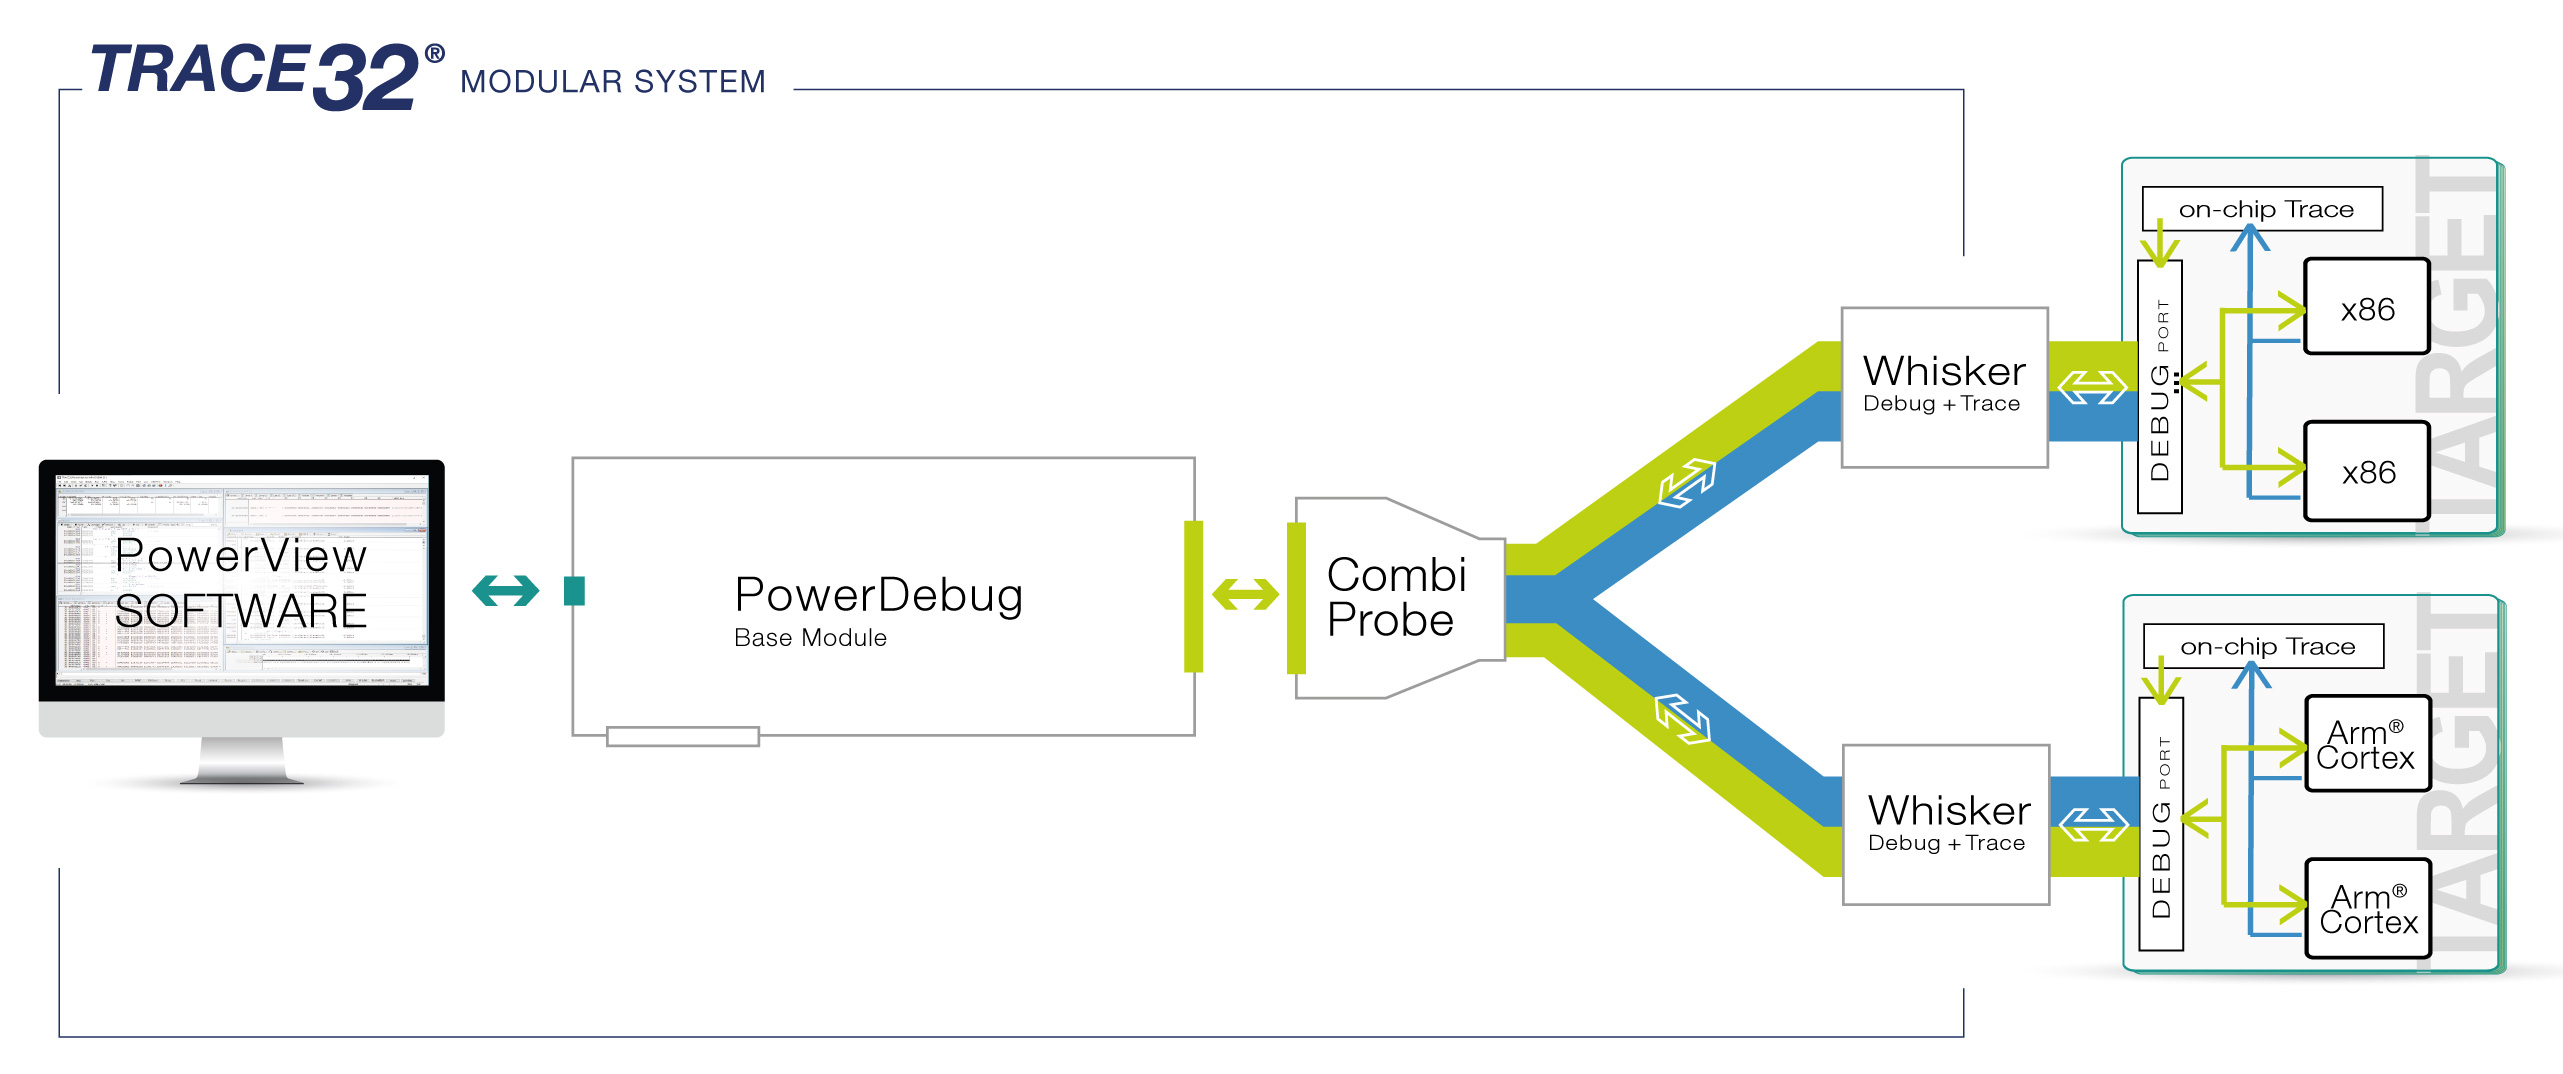
Analyze any SoC design implementing both the x86 and other Instruction Sets (ISA), from a single tiny x86 based microcontroller to popular chips used in client compute to massive multicore x86 server systems, with our leading edge development tools. Using our TRACE32® tools you can debug and control any x86 core (along with all of the other cores like Arm® Cortex™, Arc™, Xtensa™ and even 8051) via a single debug interface, all at the same time, if enabled by the Silicon Vendor. TRACE32® tools support real-time on- and off-chip tracing.

対応サブアーキテクチャ

Core®、Xeon®、Atom®、Pentium®、Celeron®、i486、i386、i286、i186

デバッグ・ハイライト

Utilize All Debug Features for x86 SoCs

By using our powerful debug modules you can apply our full debug feature set to any supported x86 SoCs. Utilize full on-chip breakpoint support, run-time memory access, flash programming, benchmark counters, MMU and Hypervisor support. Everything is scriptable, which enables you to automate tests very easily.

デバッグシステムの詳細 
インテル_ウィスカー-1
インテル_ソフトウェア・オンリー・デバッグ_(1)

あらゆるデバッグインターフェースプロトコルをサポート

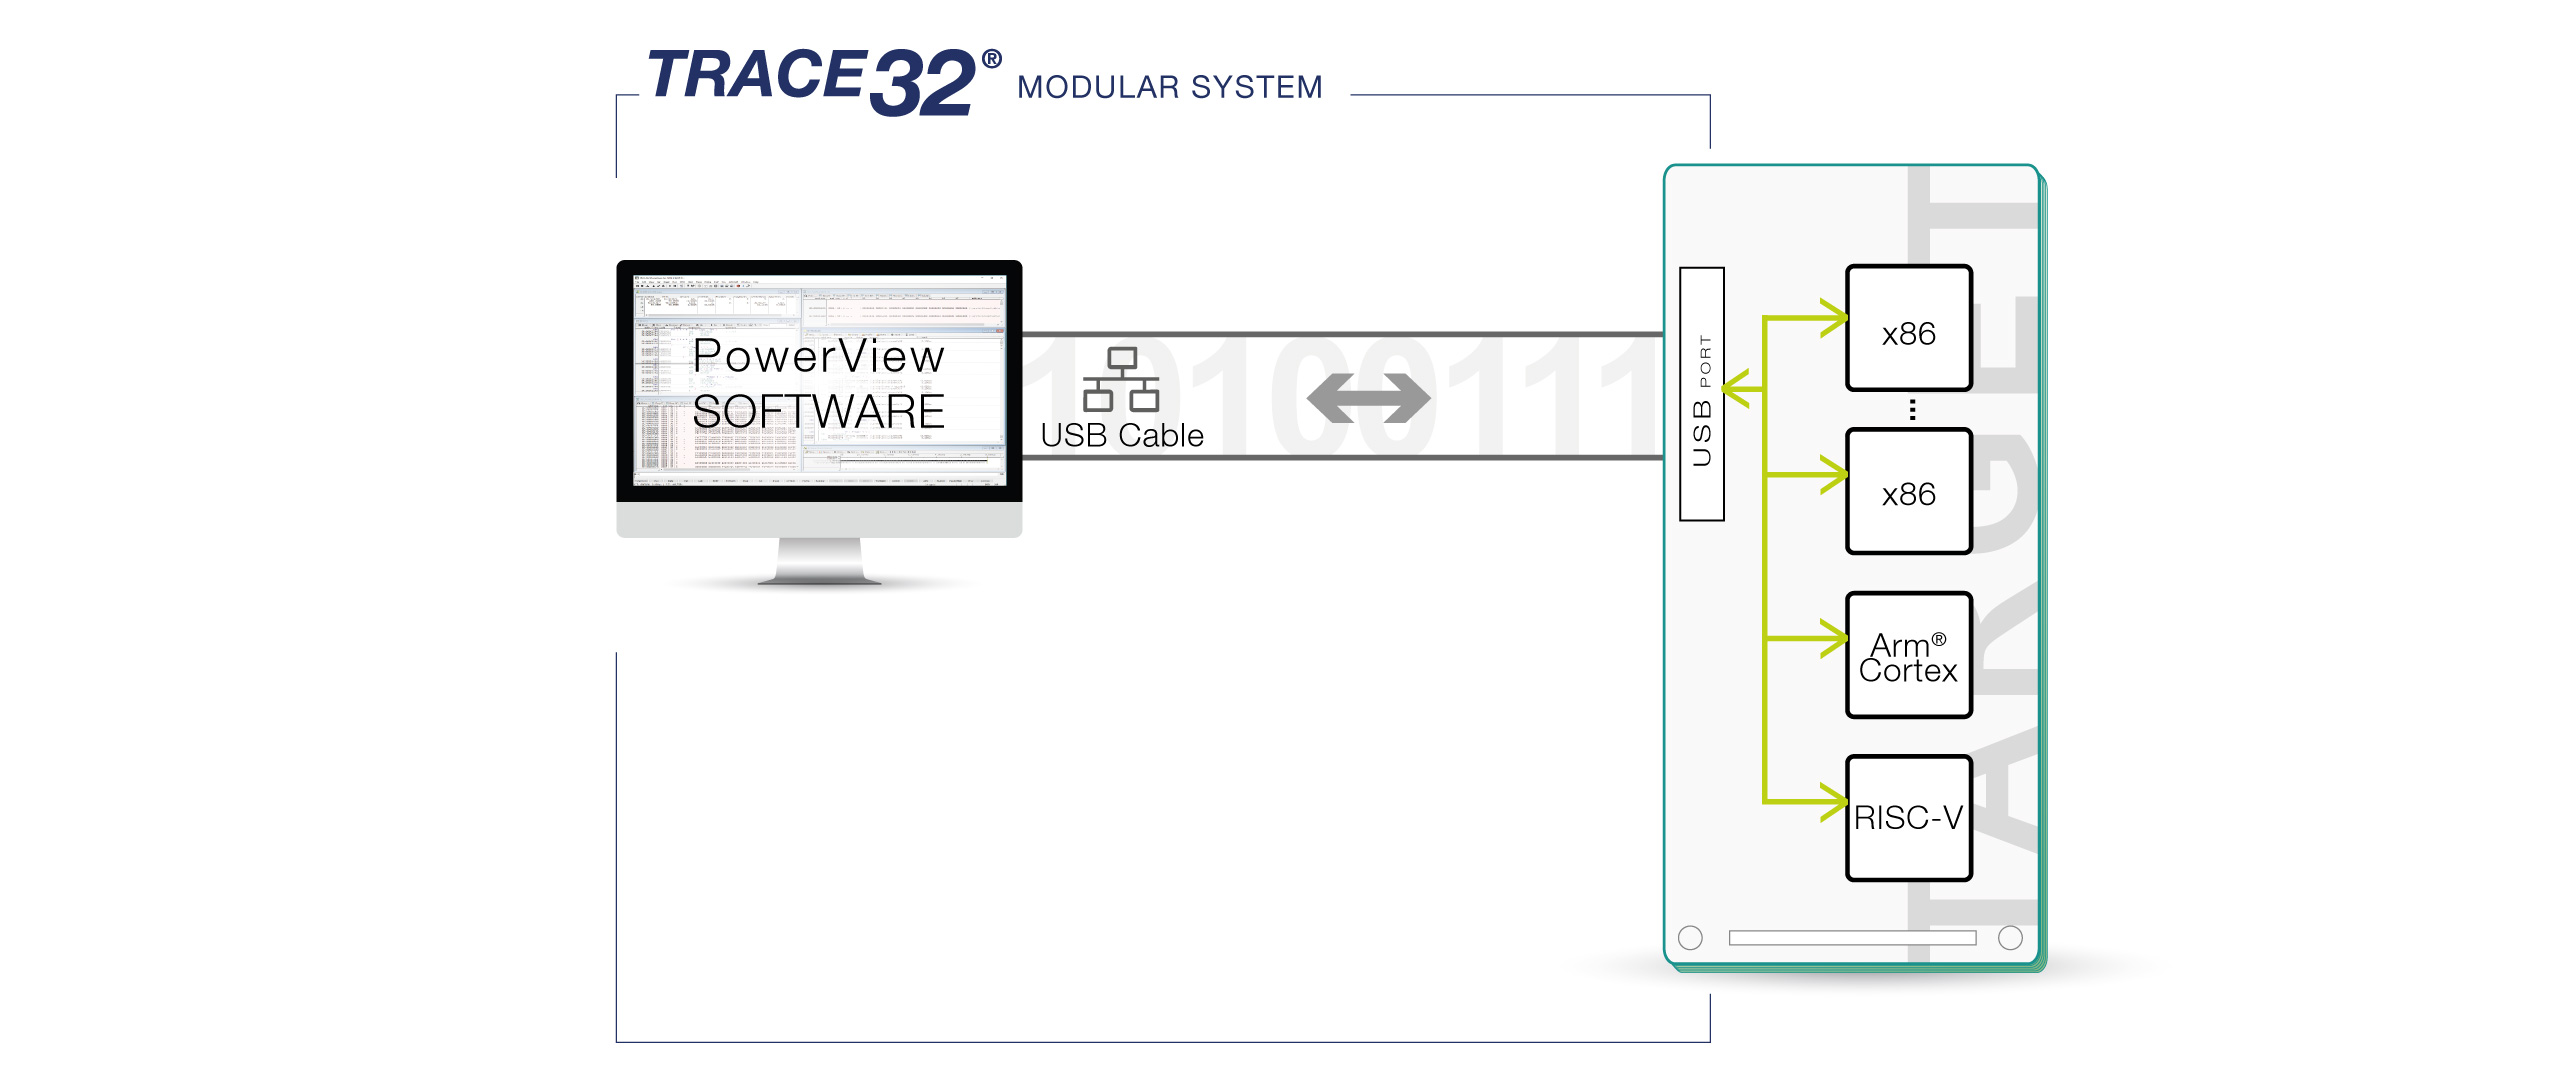
Debug via classic JTAG or USB. TRACE32® debug tools support both Intel USB DCI-OOB and software-only USB DCI-DbC protocols.

GUIベースとハイレベル言語のデバッグを楽しむ

当社のPowerView ソフトウェアは、洗練された使いやすい GUI とコマンドラインベースのデバッグを提供します。さらに、高レベル言語デバッグ(HLL)を完全にサポートし、プログラムコードを考えるよりも、全体的なロジックを考える時間を提供します。

Debug Multi-Architecture SoCs

Debug all your x86 cores and/or non-x86 cores at the same time with just one debug probe. Besides x86 we support Arm® Cortex, Arc®, Xtensa®, 8051 and other cores in symmetric (SMP including hy-perthreading) or asymmetric (AMP) multiprocessing environments. (Access might be limited by SoC vendor)

フルソフトウェアスタックのデバッグ

UEFI™、Linux™、Windows™、AUTOSAR等の多くの一般的なターゲットOSに対応。TRACE32® OS-awareデバッグは、スレッド、メッセージキューなどの全てのOSオブジェクトをクエリし、表示することができます。また、マルチOS環境のためのハイパーバイザ対応デバッグもサポートしています。

トレース機能

Capture Your Core Actions on Each Chip

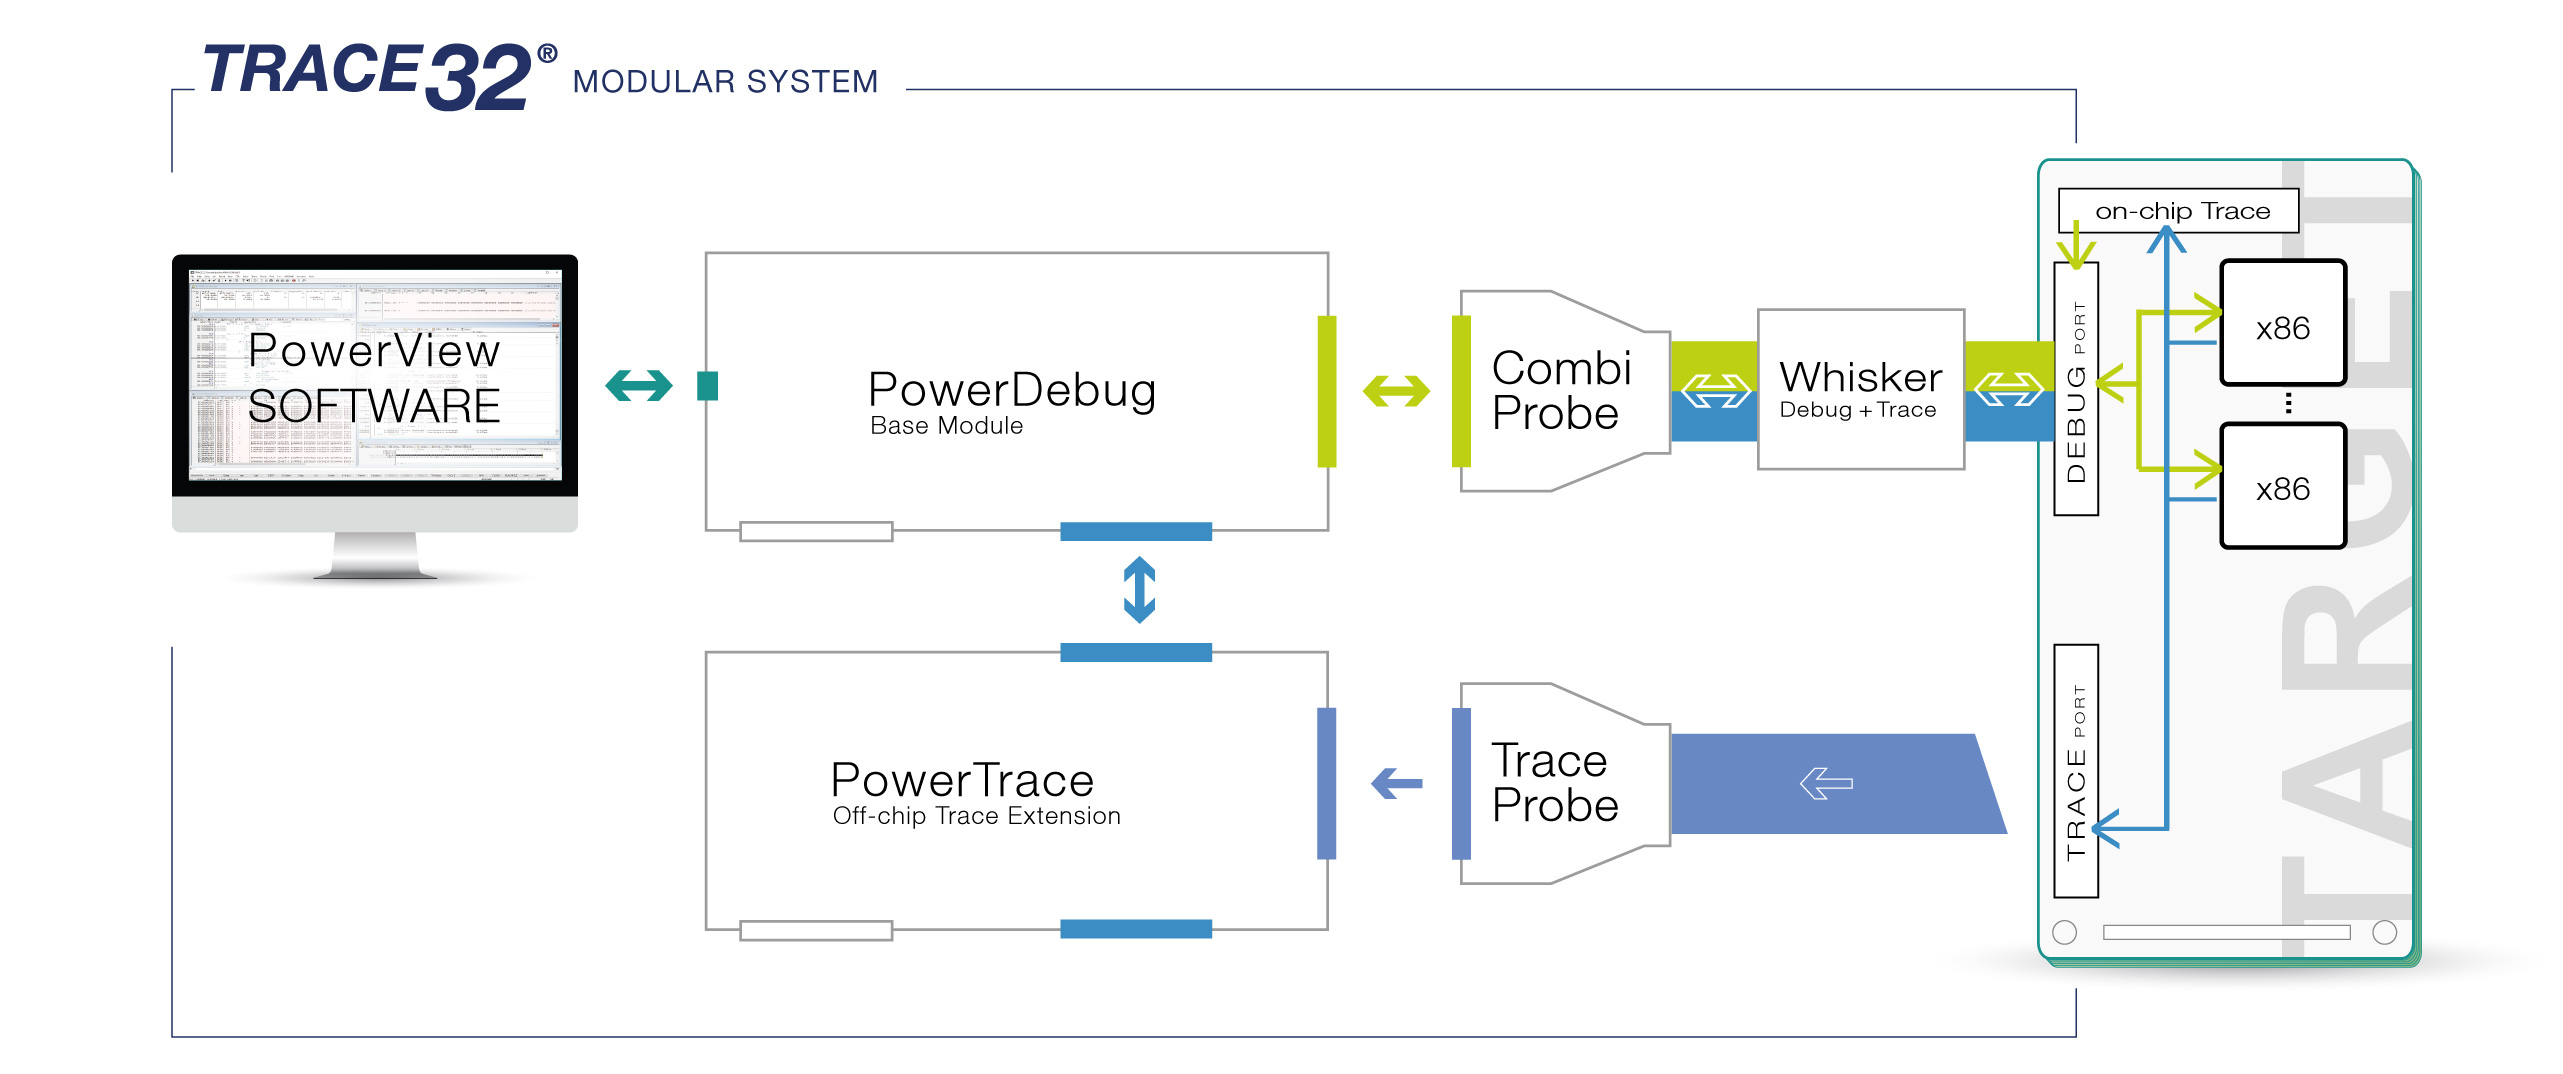
Stop mode debugging can be a powerful tool but tracing is even better. Our trace solutions for support both on-chip trace for various technologies as well as the much more powerful off-chip trace, which can save the trace data inside the target memory or emit it to our PowerTrace tool (off-chip trace on selected platforms).

トレースシステムの詳細  


インテル_ウィスカー2

オフチップトレースで最高のパフォーマンスを提供

当社のPowerTraceモジュールとインテル用プリプロセッサの組み合わせは、システムのリアルタイム性能に影響を与えることなく、最高性能のIntel® SoCからのトレースデータを提供し、各ステップの記録を作成します。使用されるチップによっては、弊社のTRACE32®PowerView ソフトウェアまたはIntel System Studioを使用して、即座にデータの検証を開始することができます。

Support of All x86 On-Chip Trace Solutions

Our TRACE32® tools support every Trace solution which could be implemented in your x86 SoC: The Basic On-Chip Trace (LBR), the Advanced On-Chip Traces (Processor Trace PT and Branch Trace Store BTS) and the Arm CoreSight™ trace infrastructure. Besides your already existing debug module there is no additional trace hardware required.

マルチプルコア間の相互作用の分析

Our trace solutions support multicore tracing to record and analyze the dynamic interaction between cores. For mixed-architectures , you can concurrently trace x86 and non-x86 cores.

詳細なランタイム情報の取得

当社のトレースソリューションは、SoCトレースIPによって提供される完全なプログラムフローを記録することができます。記録されたデータに基づいて、詳細なタイミング測定を行うことができます。

バーチャル・プロトタイピング

シリコンの前に準備を整えよう

Test your code in your SoC before your SoC is ready. Taping out your SoC takes a lot of time, but TRACE32® allows you to start software development on virtual prototypes and simulators, using the same GUI and toolset that you would use later with the real chip. To some extent it is also possible to verify the debug interface of your individual SoC before starting the taping out.

トレースシステムの詳細  


インテル_ソフトウェア専用エミュレータ_(1)

インストラクションセットシミュレータによるユニットテスト

TRACE32®PowerView は、モジュールテストやリグレッションテストに最適な命令セットシミュレータを内蔵しています。

プレシリコン検証の実施

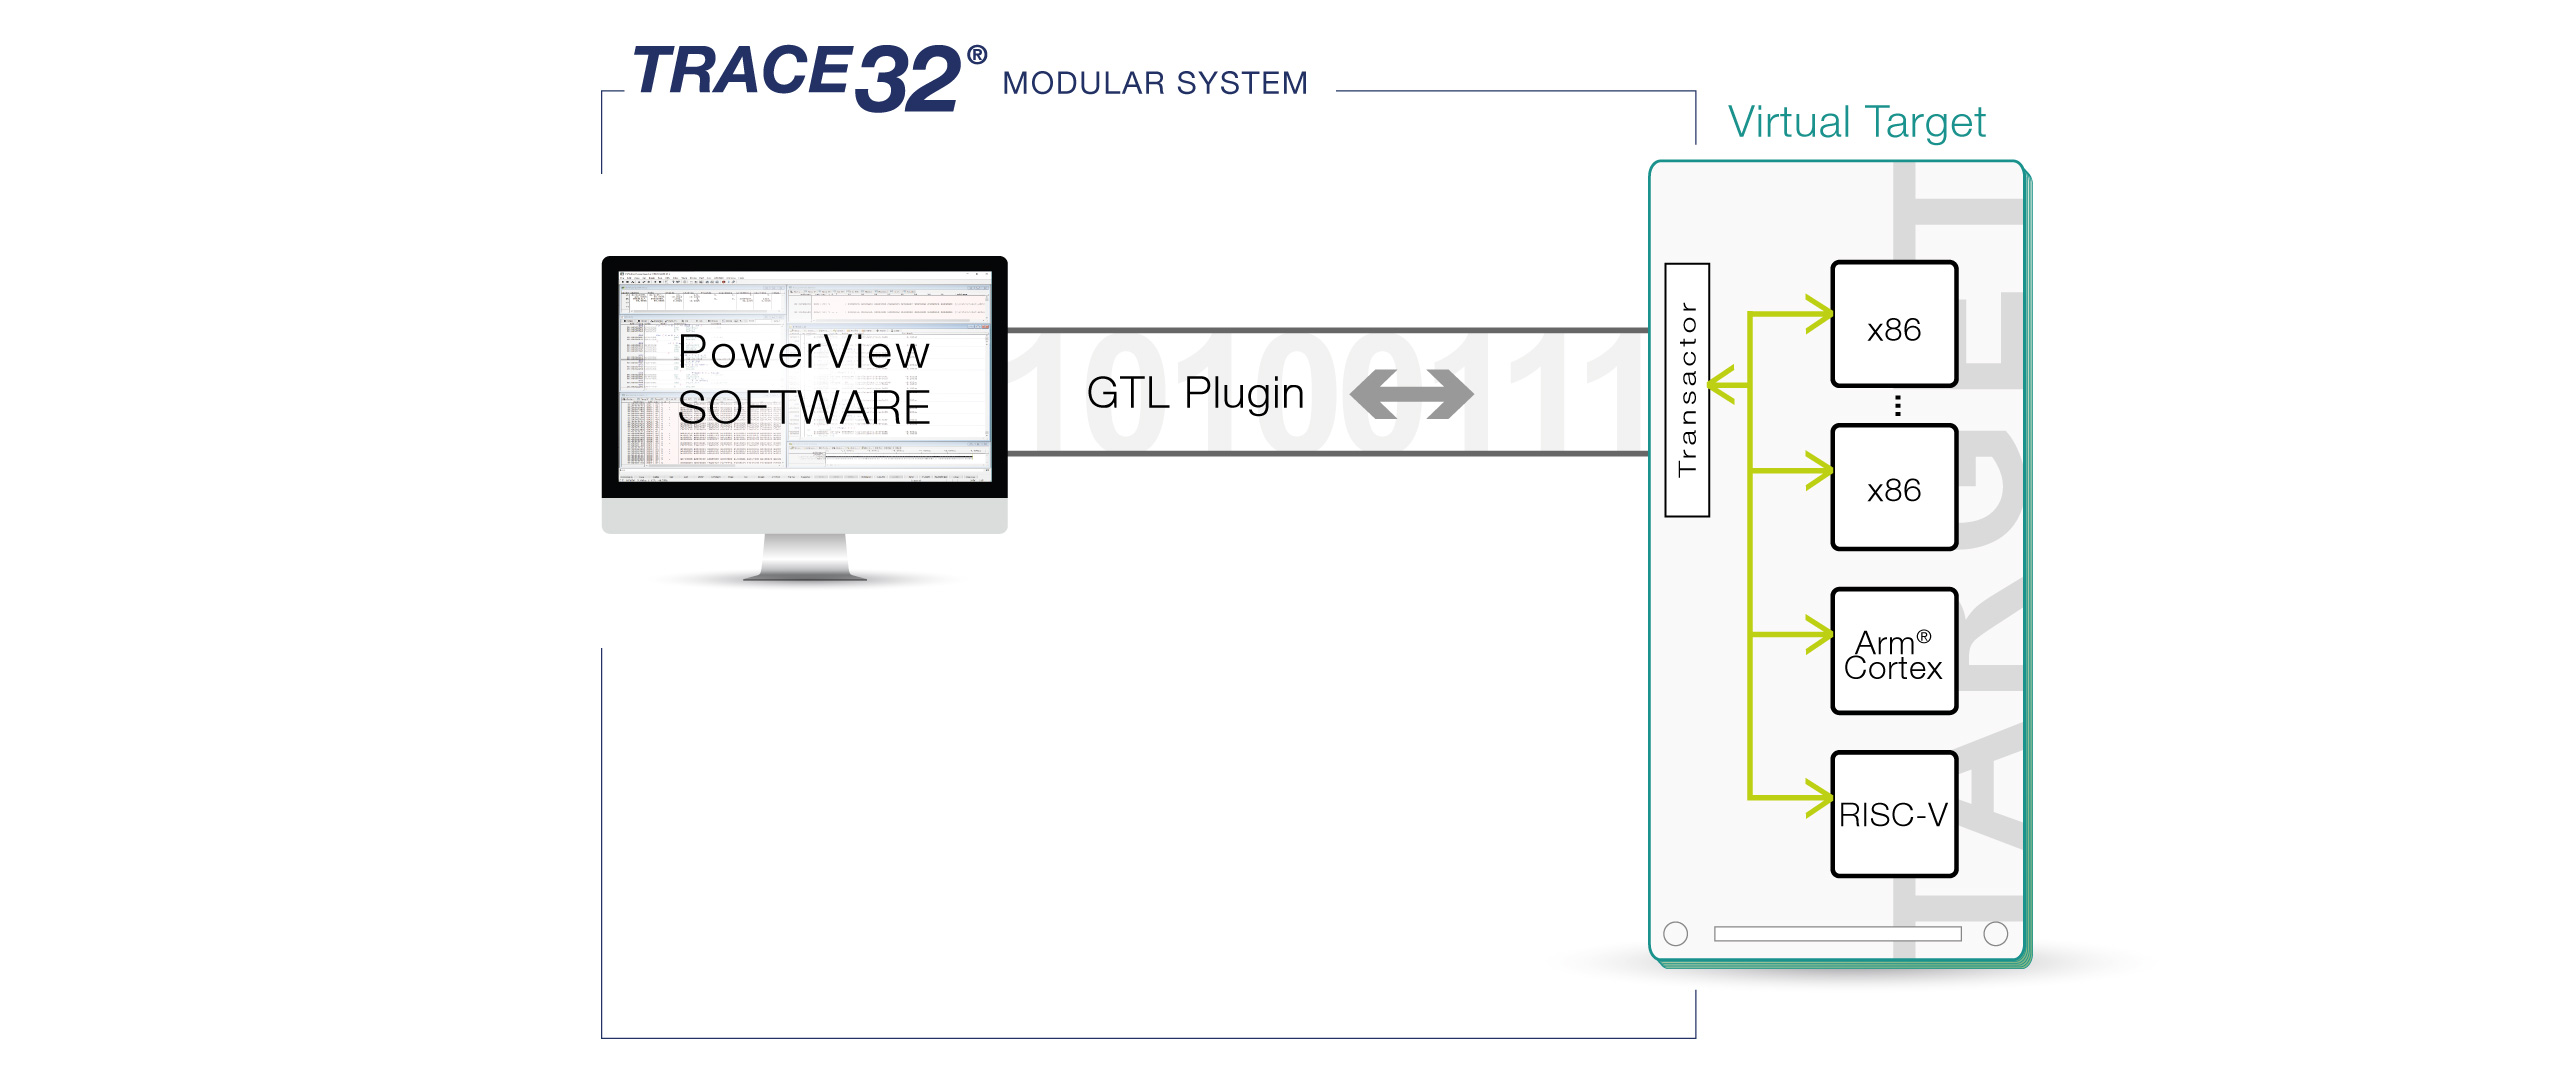
シミュレートされたVerilogまたはVHDLネットリストを使用して、テープアウト前にデバッグメカニズムを含むSoCを検証します。ローターバッハ Generic Transactor Library (GTL)を使用すると、JTAGレベルでプレシリコンデバッグを実行できます。

ツールチェーンサポート

3rd Party Tools Supported for x86

以下の機能は、TRACE32 がサポートするすべてのアーキテクチャで利用可能です。お使いのデバイスやツールがここに掲載されていない場合は、お問い合わせください。

ホストOS

当社のデバッグソフトウェアは、すべての主要なオペレーティングシステムで動作します。

フラッシュデバイス

当社は、多種多様なフラッシュデバイスのプログラミングをサポートしています。NOR、NAND、SPI、QSPI、EMMC など。

サードパーティとの統合

統合により、TRACE32 を他のツールと簡単に使用することができます。

関連製品

TRACE32 Related Products for x86

フィルター

フィルター
27 製品が見つかりました
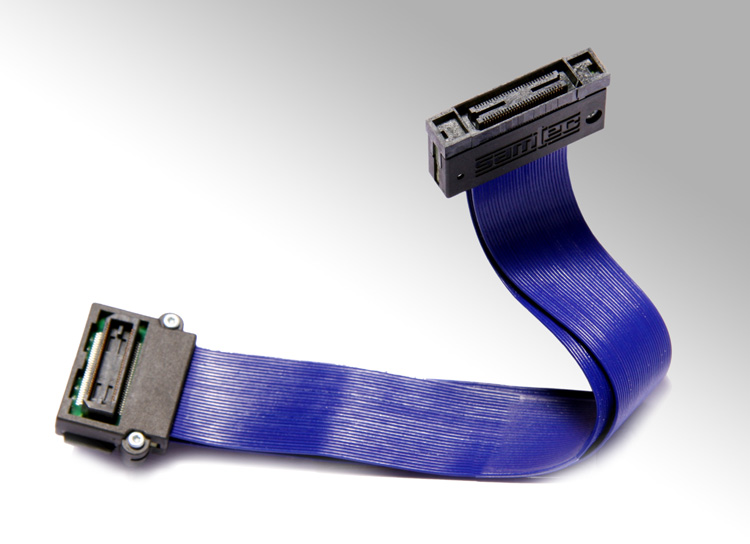
Flex Ext. for SAMTEC 60 pin BTH-BSH series LA-1229 | Not recommended for new projects
See details